
Strategies with Heikin-Ashi patterns
Heikin-Ashi means “average bar” in Japanese.
Introduction
Heiken-Ashi candles essentially captures the pace of price.
Market fluctuations, volatility and price oscilattion lead to the formation of alternating bullish and bearish candles. The movement makes it difficult to judge the trend. To overcome this, chartists use smoothing techniques and this is where Heiken Ashi shines. Heiken Ashi make trends easier to spot and help traders to remain longer in trade.
The Heikin-Ashi technique can be used in conjunction with candlestick charts when trading securities to spot market trends and predict future prices. It’s useful for making candlestick charts more readable and trends easier to analyze. For example, traders can use Heikin-Ashi charts to know when to stay in trades while a trend persists but get out when the trend pauses or reverses.
The resulting candlestick filters out some noise in an effort to better capture the trend. The time series is defined by the user, depending on the type of chart desired, such as daily, hourly or five-minute intervals.
The values used to construct Heiken Ashi candlesticks, are averages. Averaging helps to smooth out short-term price variations. Since it’s taking an average of the movement, the candlestick has a smoother look. These candlesticks can be used to identify trending periods, potential reversal points and classic technical analysis patterns.
How Heikin-Ashi is calculated
Heiken Ashi candlesticks are similar to conventional ones, but rather than using opens, closes, highs and lows, they use average values for these four price metrics.
Each of the Heikin Ashi bars start from the middle of the bar before it, and not from the level where the previous candle has closed. This is a major distinguishing factor between the standard and HA candlestick patterns.
Heikin-Ashi Candlesticks use the open-close data from the prior period and the open-high-low-close data from the current period to create a combo candlestick. The Heiken Ashi formula used to derive these average values is as follows:
Open = (open of previous bar + close of previous bar)/2
Close = (open + high + low + close)/4
High = the maximum value from the high, open, or close of the current period
Low = the minimum value from the low, open, or close of the current period
Heikin-Ashi Open price is a result of the previous Heikin-Ashi values. So the first HA candle is calculated using below standard solution:
HA_Close = (Open + High + Low + Close) / 4
HA_Open = (Open + Close) / 2
HA_Low = Low
HA_High = High
How to interprete and indentify trends using Heikin-Ashi patterns
Heikin-Ashi Candlesticks provide chartists with a versatile tool that can filter noise, foreshadow reversals and identify classic chart patterns. It support all aspects of classical technical analysis and charting. Chartists can use Heikin-Ashi Candlesticks to identify support and resistance, draw trend lines or measure retracements. Volume indicators and momentum oscillators also work well. Heikin Ashi charts are often used as a technical indicator on a typical candlestick chart, to help highlight and clarify the current trend.
Heikin Ashi charts are sometimes by swing traders or investors. Day traders tend to use Heikin Ashi charts more as an indicator, as HA charts have certain other benefits. There are five primary signals that identify trends and buying opportunities:
- green candles signify an uptrend
- green candles with no lower “shadows” indicate a strong uptrend
- candles with a small body surrounded by upper and lower shadows indicate a trend change
- red candles indicate a downtrend
- red candles with no higher shadows identify a strong downtrend
A Heiken Ashi trader looks for two particular signals:
- A green candle without a lower shadow, which is a particularly bullish signal
- A red candle without an upper shadow, which is a particularly bearish signal
These signals may make locating trends or trading opportunities easier than with traditional candlesticks. The trends are not interrupted by false signals as often and are thus more easily spotted.
Common Heiken Ashi Candle Types & patterns
Size of body, shadows, and range of candle determines whether it is bullish, bearish or a neutral candle.
- continuation candles - Small narrow range candles
- strong up-trend candles - wide range candles with no tail
- strong down-trend candles
- indecision candle - small body, long tail and shadow on both sides. These represent Trend change or pause in Trend
- Doji candle
- Spinning top candle
- Bearish candles - Such candles do not have any shadow
Some of the common patterns formed on the Heikin Ashi chart include: Doji Reversal Candlestick Triangle Patterns Rising Wedge and Falling Wedge Patterns
Initiation candle is one that sets the tone of Trend and defines underlying momentum for price. This is why Initiation candles are most important in Trend Analysis and Price action trading. Continuation candles are ones that reaffirm the direction of trend and are useful to increase positions in the direction of trend.
Heikin-Ashi doji and spinning tops
As with normal candlesticks, Heikin-Ashi doji and spinning tops can be used to foreshadow reversals. A Heikin-Ashi doji or Heikin-Ashi spinning top looks just the same as a normal doji or spinning top.
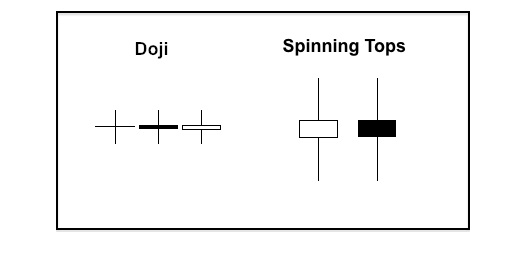
- A doji is a small candlestick with an open and close that are virtually equal. There are small upper and lower shadows to denote little price movement.
- Spinning tops have small bodies (open-close range) and long upper/lower shadows (high-low range). Despite a lot of movement from high to low, prices finish near their opening point for little change. This shows indecision that can foreshadow a reversal.
When using Heikin-Ashi candlesticks, a doji or spinning top in a downtrend should not immediately be considered bullish. It just shows indecision within the downtrend. Indecision is the first step to changing direction. Confirmation of a directional change (trend reversal) is required though. Once chartists spot a doji or spinning top in a downtrend, it is time to set a resistance level upon which to base a trend reversal.
Trade strategies with Heiken-Ashi
There are broadly 5 patterns that need to be followed when trading with Heiken Ashi Candles.
- Green candles with no lower shadows indicate a strong uptrend: When you spot these on charts, be in the trade and don’t think about profit booking. You might want to add to your long position and exit short positions.
- Candles with a small body with upper and lower shadows indicate trend change: These are indecision candles and require more confirmation.
- Green/Red candles with no upper shadow indicates strong a downtrend: When you spot these on charts, be in the trade and don’t think about profit booking. You might want to add to your short position and exit long positions
- Candles with long lower shadows represent Buying interest. Always take note of these candles and assess price action after you spot these candles.
- Candles with long upper shadows represent selling interest and be cautious with existing long positions if you spot such Candles.
Every Heikin Ashi trading system should include price action rules:
- Look for Support and Resistance levels.
- Look for chart patterns for potential breakouts.
- Hop into emerging trends and exit on slowing trends.
** Trailing Stop Method ** Using a trailing stop is a good technique to pursue in a trending market. Smoothing benefits of the Heikin Ashi chart can be combined with a trailing stop indicator to get the most out of a trending market condition.
** Heiken Ashi Trading Strategy For Short & Longer Time Frame Charts **
** Heiken Ashi Expansion Pattern **
** Heiken Ashi Double Bottom Momentum Pattern ** https://tradingwithtrend.com/heiken-ashi-strategy
Using Heiken Ashi along with momentum indicators, helps it easier to confirm the trend. For example, a Heiken Ashi moving average strategy might wait for the candles to cross over a 50-period moving average, as an entry signal.
You would enter once the next confirming candle occurs, that being a bullish candle, if you were waiting to buy after an upward crossover - and vice versa.
Similarly, you could use a Ichimoku cloud. Ichimoku cloud a.k.a Ichimoku Kinko Hyo, is a candlestick-based, trend-following system. It was originally designed with regular candlesticks in mind, but some traders use Heiken Ashi candles instead. This Ichimoku Heiken Ashi combination can enhance your strategy and make it easier to stick with the trend.